Non-parametric regressions
Intro to non-parametric regressions.
require(ggplot2)## Loading required package: ggplot2require(data.table)## Loading required package: data.tablerequire(reshape2)## Loading required package: reshape2##
## Attaching package: 'reshape2'## The following objects are masked from 'package:data.table':
##
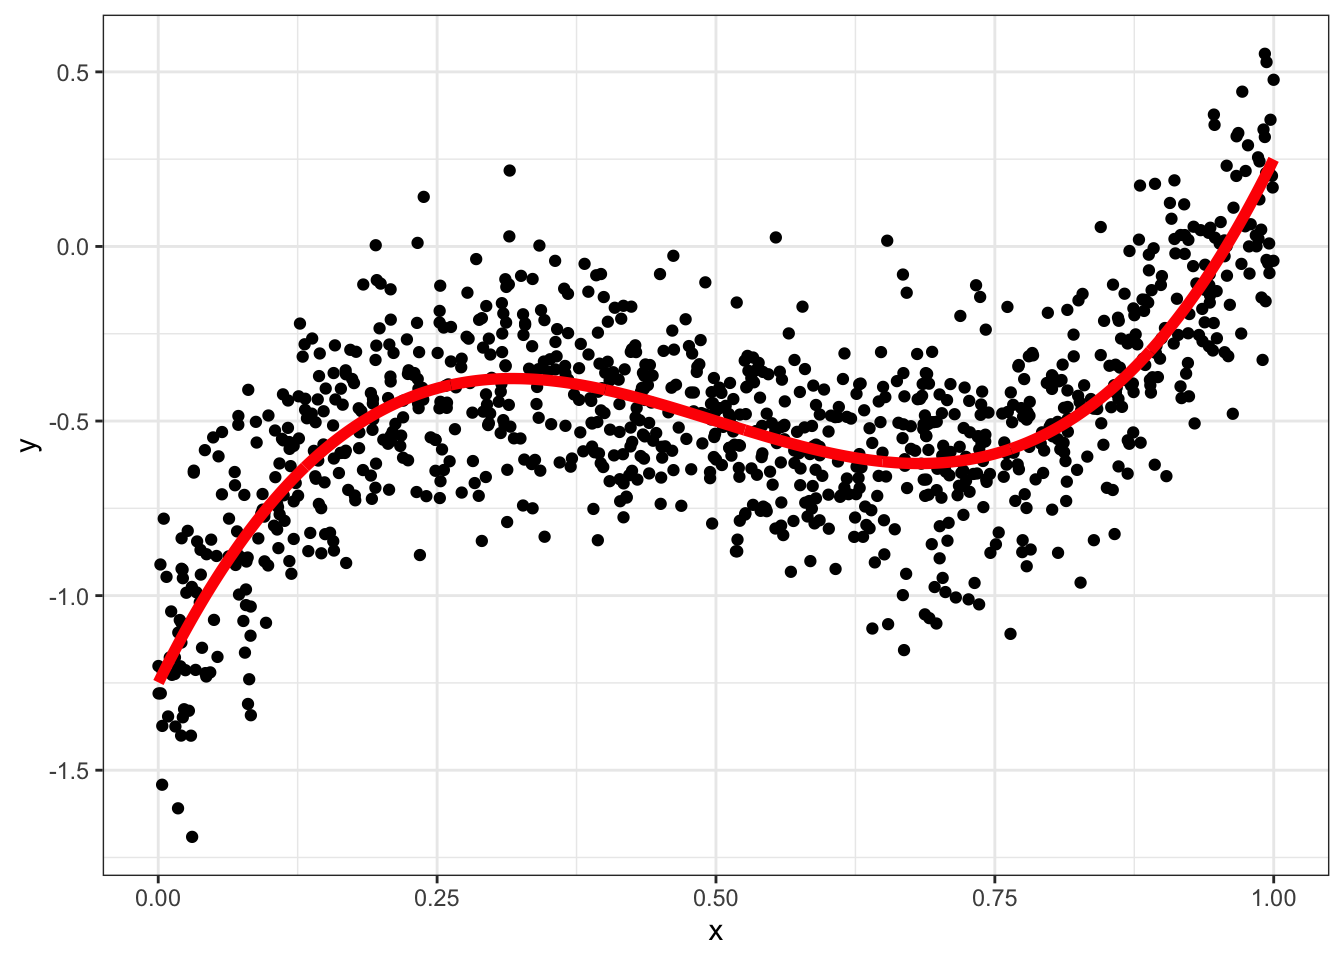
## dcast, meltX = runif(1000);
Y = 10*((X-0.5)^3 - 0.1*X) + 0.2*rnorm(1000)
data = data.table(x=X,y=Y,yt=10*((X-0.5)^3 - 0.1*X))
ggplot(data,aes(x=x,y=y)) + geom_point() + geom_line(aes(y=yt),color="red",size=2) +theme_bw()
fit = lm(y~x,data)
data = data[,y_hat := predict(fit)]

ggplot(data,aes(x=x,y=y)) + geom_point() +
  geom_line(aes(y=yt),color="red",size=2) + geom_line(aes(y=y_hat),color="blue",size=2) +theme_bw()
A simple tree regression
require(rpart)## Loading required package: rpartfit = rpart(y~x,method="anova",data)
data = data[,y_hat_tree := predict(fit)]
ggplot(data,aes(x=x,y=y)) + geom_point() + geom_line(aes(y=yt),color="red",size=2) +
geom_line(aes(y=y_hat_tree),color="green",size=2)+theme_bw()
# plot tree
plot(fit, uniform=TRUE, main="Classification Tree for Chemicals")
text(fit, use.n=TRUE, all=TRUE, cex=.8)
Kernel Estimator
# show one kernel

g <- function(x0,h) data[, sum( y * dnorm( (x-x0)/h))/sum( dnorm( (x-x0)/h)) ]
data = data[, kern_val1 := dnorm( (x-0.25)/0.1) ,x]
data = data[, kern_val2 := dnorm( (x-0.25)/0.01) ,x]

ggplot(data,aes(x=x,y=kern_val1)) + geom_line() + geom_point(aes(y=y,alpha=kern_val1)) + theme_bw() 
ggplot(data,aes(x=x,y=kern_val2)) + geom_line() + geom_point(aes(y=y,alpha=kern_val2)) + theme_bw()
g <- function(x0,h) data[, sum( y * dnorm( (x-x0)/h))/sum( dnorm( (x-x0)/h)) ]

data = data[, y_hat_kern := g(x,0.1),x]
ggplot(data,aes(x=x,y=y)) + geom_point() + geom_line(aes(y=yt),color="red",size=2) +geom_line(aes(y=y_hat_kern),color="green",size=1) +
   theme_bw()
doing cross-validation
data = data[,i:=1:.N]

g2 <- function(x0,h,ii) data[i!=ii, sum( y * dnorm( (x-x0)/h))/sum( dnorm( (x-x0)/h)) ]

# for each point, we estimate the model leaving it out, we then predict the value for that point
# we then compute the distance with y

mse = rep(0,50)
hs = seq(0.002,0.05,l=50)
for (j in 1:50) {
  data[, y_hat_lo := g2(x,hs[j],i),i]
  mse[j] = data[,sum((y-y_hat_lo)^2)]
}

hstar = hs[which.min(mse)]
ggplot(data.frame(hs,mse),aes(x=hs,y=mse)) + geom_point() + geom_line() + theme_bw() + geom_vline(xintercept = hstar,color="red",linetype=2)
g <- function(x0,h) data[, sum( y * dnorm( (x-x0)/h))/sum( dnorm( (x-x0)/h)) ]
data = data[, y_hat_kern := g(x,hstar),x]

ggplot(data,aes(x=x,y=y)) + geom_point(alpha=0.5)  +
geom_line(aes(y=yt),color="red",size=1,linetype=2) + geom_line(aes(y=y_hat_kern),color="blue",size=1) + theme_bw() 
Sieve estimator
Here we use a simple basis function approach.
require(splines)## Loading required package: splinesn = 50
D = spline.des(seq(-0.2,1.2,l=n),x = data$x,outer.ok=TRUE,ord = 3)
rr = data.frame(D$design)
rr$x = data$x
rr = melt(rr,id.vars = c("x"))
ggplot(rr,aes(x=x,group=variable,y=value,color=factor(variable))) + geom_line() + theme_bw()
# fitting

fit = lm(data$y ~ D$design)
data =  data[,y_hat_spline := predict(fit)]

ggplot(data,aes(x=x,y=y)) + geom_point(alpha=0.5)  +
geom_line(aes(y=yt),color="red",size=1,linetype=2) + geom_line(aes(y=y_hat_spline),color="blue",size=1) + theme_bw() 
Max rank estimator
N=1000
X = array(rnorm(2*N),c(N,2))
beta = c(-0.2,0.7)
R = X %*% beta
data = data.table(data.frame(X=X,R=R,U=rnorm(N)))
require(lattice)
## Loading required package: latticecloud(R~X.1+X.2,data,alpha=1)
# generate output
data <- data[,Y := (R+U>0)]

# score function
score <- function(beta) {
  X = data[,cbind(X.1,X.2)]
  Y = data$Y
  tot = 0;
  for (i in 1:N) {
    tot = tot + sum((X %*% beta < as.numeric(X[i,] %*% beta)) * (  Y < Y[i] ) + (X %*% beta > as.numeric(X[i,] %*% beta)) * (  Y > Y[i] ))
  }
  return(data.frame(b1=beta[1],b2=beta[2],val=tot))
}

require(foreach)
## Loading required package: foreachrr = data.table(foreach(b1 = seq(-1,1,l=20),.combine=rbind) %:% foreach(b2 = seq(-1,1,l=20),.combine=rbind) %do% score(c(b1,b2)))
wireframe(val~b1+b2,rr)
I = which.max(rr$val)
beta_hat = as.numeric(rr[I,c(b1,b2)])

ggplot(rr,aes(x=b1,y=val,color=b2,group=b2)) + geom_line() +theme_bw() +
  geom_vline(xintercept = beta[1],color="red",linetype=2) +
  geom_vline(xintercept = beta_hat[1],color="blue",linetype=2)
ggplot(rr,aes(x=b2,y=val,color=b1,group=b1)) + geom_line() +theme_bw() +
  geom_vline(xintercept = beta[2],color="red",linetype=2) +
  geom_vline(xintercept = beta_hat[2],color="blue",linetype=2)
Recovering the distribution of unbosverables:
data[,R_hat := X%*%beta_hat]
g <- function(x0,h) data[, sum( Y * dnorm( (R_hat-x0)/h))/sum( dnorm( (R_hat-x0)/h)) ]
h=0.2
data = data[, F_hat := g(R_hat,h),R_hat]

ggplot(data,aes(x=R_hat,y=F_hat)) + geom_line(color="red") + geom_line(aes(x=R,y=pnorm(R)),color="blue",linetype=2) + theme_bw()